

Who’s sitting at your tables tonight, and what do they really want from the experience?
In an industry where every cover counts, the most successful restaurants aren’t just guessing. They’re studying the who behind every reservation.
Understanding your guests’ demographics like age, income, location and lifestyle unlocks insights that can shape everything from your menu and marketing to your floor plan and follow-ups.
When you know which guests are willing to spend, and what they value most, you can deliver the kind of personalized hospitality that keeps them coming back.
Let’s break down how to use restaurant demographics to design experiences that feel personal, profitable and unforgettable.
What are restaurant demographics?
Restaurant demographics are the statistical traits of a restaurant’s customer base such as age, gender, income, location and dining habits. Understanding these characteristics helps operators design menus, set pricing and create marketing strategies that resonate with the right audience.
These insights fall under four key segments: demographic, psychographic, geographic and behavioral data.
When you combine these insights, you can better design menu offerings, tailor events and promotions and segment marketing communications based on your customer base.
Why restaurant demographics drive loyalty
Trends suggest diners are becoming more mindful with money, but are also more loyal to restaurants that personalize their experience:
Key restaurant demographics to track
So, which restaurant customer demographics should you be paying attention to? Here are several to keep front of mind:
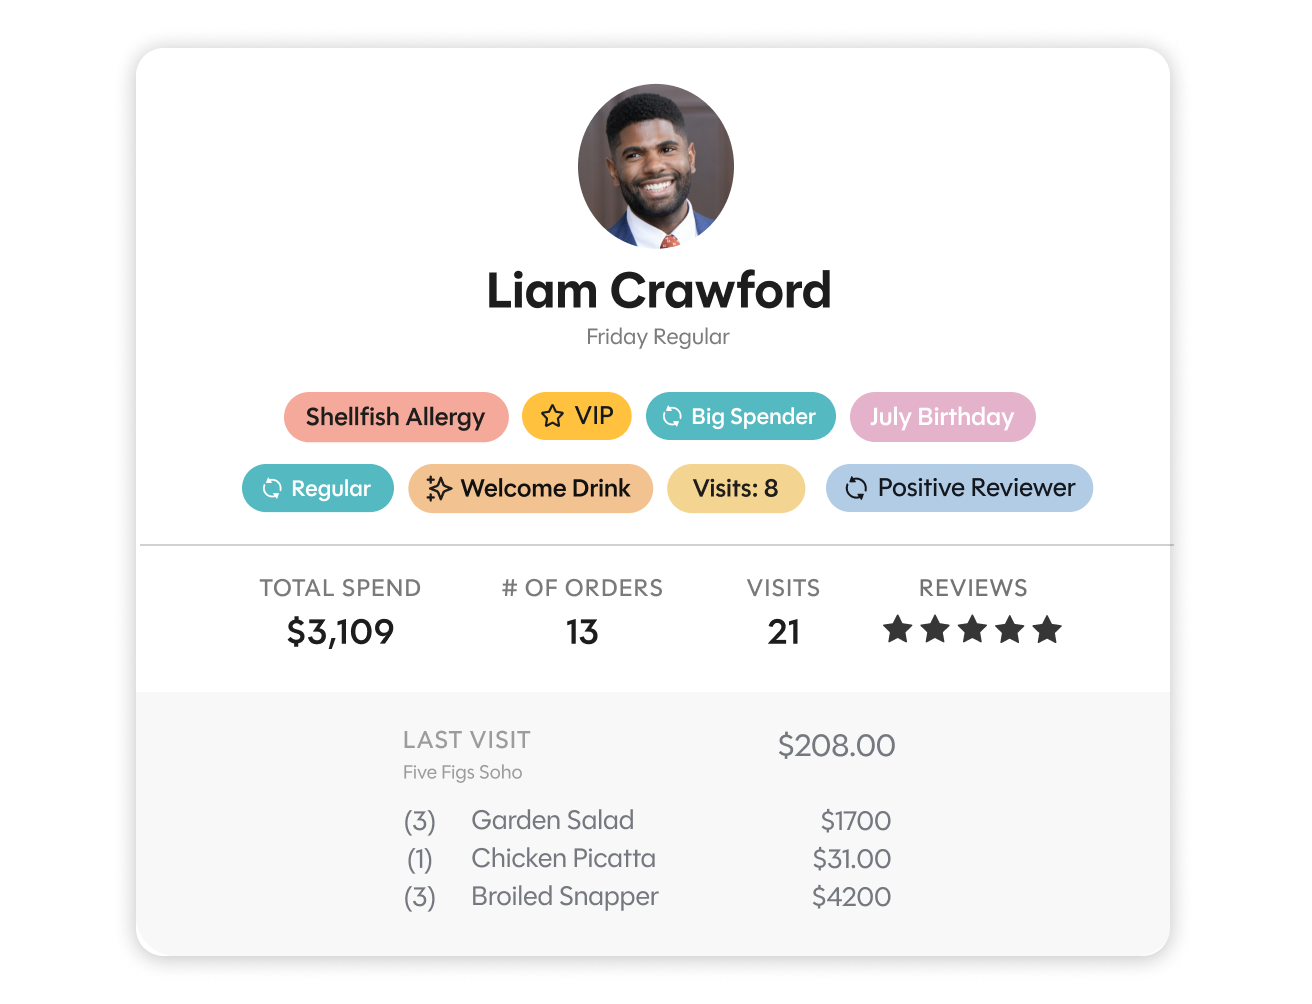
A robust reservation and CRM system like SevenRooms automatically creates rich guest profiles with details such as contact information, dietary and dining preferences, special occasions, visit frequency and spend. Many of these insights can be gathered seamlessly during the booking process.
Restaurant demographics by generation
Age plays a huge role in customers’ dining habits, so we wanted to highlight this critical demographic and what it means for restaurants. Here’s an overview of dining preferences by generation.
Gen Z (born 2001 – 2013)
Millennials (1980 – 2000)
Gen X (1965 – 1979)
Boomers (1943 – 1964)
Tools for collecting restaurant demographic research
You don’t need to hire a detective to learn more about your guests. Use these tactics to research your restaurant’s demographics.
How to leverage customer demographics at your restaurant
Now that you have customer data, what should you do with it? These applications will help you make the most of the demographics you’ve collected.
Segment your email list
With customer data, you can better segment your email list and send personalized messages and promotions to the customers who will be most receptive to them.
For example, here are the top personalized email campaigns that drive the highest repeat visit rates:
62% of consumers prefer connecting with restaurants via email. Segmented, personalized and automated emails average a 68% open rate.
Improve customer service
Demographics help you understand your customer base as a whole. Individual customer data helps you provide better service.
When servers can view a guest’s profile while they’re seated, they can recognize who they’re interacting with and provide customers with a VIP experience.
For example, if a regular who typically dines with her young children makes a reservation, you can anticipate her needs by bringing a high chair and kids' food menu without being asked.
Make better recommendations
When you look at data in a guest’s profile, you can see their dining preferences and can make suggestions accordingly. If a guest usually chooses red wine over white, you can recommend a special bottle of Merlot. In fact, 53% of diners are willing to pay more for personalized beverage pairings.
Personalization + demographics = Repeat guests
Knowing your restaurant’s customer demographics can help you run a more successful business. Use technology, conduct research surveys, monitor analytics and observe guests to learn more about them. Then, turn that data into a better dining experience.
SevenRooms can help you store and gather your restaurant’s customer demographics. Request a demo today.
Restaurant Demographic FAQs
1. Which restaurant customer demographic dines out the most?
According to recent trends, millennials (defined as those born between 1980 and 2000) spend the most dining out, averaging $95 per week. While 43% of millennial respondents said they dine out for convenience, 49% said they eat in restaurants because it provides a social setting for them to spend time with friends and family.
2. What are the best methods to research restaurant customer preferences?
Restaurants gather data through reservations, loyalty programs, surveys, POS systems and online opt-ins. Today’s guests are comfortable sharing contact information, birthdays, anniversaries and dining preferences when they see a clear benefit in return.
3. How does demographic research influence restaurant menu development?
Demographic research shapes menus that resonate. Understanding guests’ age, income, culture and lifestyle helps operators design offerings that feel relevant—from plant-forward dishes for younger diners to experiential options for luxury audiences. When paired with SevenRooms’ guest data, demographic insights drive smarter, more personalized menu decisions.
4. How can demographic data improve restaurant location decisions?
Using demographic data allows restaurants to take a data-led approach to expansion. By blending CRM insights with local population, income and lifestyle information, operators can uncover where their most loyal guests live and replicate that success in similar markets, ensuring each new opening is grounded in real opportunity.